Solutions

Technical analysis

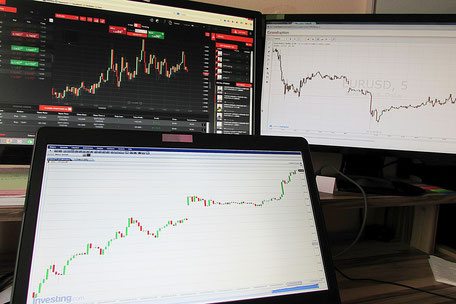
Technical analysis, also known as chart analysis, is a form of financial analysis. It attempts to identify favorable points in time at which to buy or sell based on the price and revenue history of the underlying asset, i.e. to predict the price development – or at least its probability of occurring.
Whether for moving averages, indicators or chart types - TAI-PAN End-of-Day, TAI-PAN Realtime and partner products have a wide array of functions and interpretations at their disposal for a detailed technical analysis.
Technical analysis
Fundamental analysis

Fundamental analysis

Fundamental analysis attempts to determine the fair or appropriate price of securities. In contrast to chart analysis, it is based on business data and the economic environment of a company, the so-called fundamental data. Using the chart and clear evaluations,TAI-PAN End-of-Day shows you how factors such as EBIT, EBIT margin, revenue, profit, cash flow, cash flow margin and all other important corporate figures have developed in recent years.

Market scanner

The number of existing stocks, funds, certificates and other securities is almost uncountable. Thousands of titles are available in the various sectors and countries. Thus, the question of the "right" securities, is nearly impossible to answer. If you want to search for stocks based on filter criteria such as indicators, price-earnings ratio, dividend yield or criteria you have created yourself, then a screener or filter is exactly what you need. TAI-PAN End-of-Day and AgenaTrader, for example, include extensive screening functions.

Market scanner
Portfolio management

Portfolio management

Not every investor who wants to manage his or her stocks or securities needs a financial advisor. With the necessary knowledge, this can also be done very simply from home. With the help of portfolio management, investors can monitor their portfolios just as well as professional asset managers. Portfolio management is an important tool for long-lasting success in the capital markets. You can also use the versatile evaluation possibilities in TAI-PAN End-of-Day to create sample portfolios and to test new trading approaches and strategies for profitability, to name just a couple examples.

Data interfaces
TAI-PAN Realtime mobile version

Mobile

We are all familiar with the situation: some investment decisions simply cannot wait. The solution for TAI-PAN users: free access to the app “TAI-PAN RT mobile“ for iOS or Windows Mobile. This app gives you an overview of all the important stock exchanges and securities on your tablet or smartphone. This enables you to manage your compiled watch lists effortlessly on the go. Our charting software TAI-PAN Realtime is ideally equipped for this task.

Historical tick data

Data and time series form the basis for all analyses and backtests. The interface allows for uniform access to data from a wide variety of sources and timeframes.
For anyone who needs historical tick data for comprehensive backtests, this information is available dating back to 2002. Using the interface, you can take historical tick data directly from TAI-PAN Realtime.

Historical tick data

Which product is the right one for me?

Are you unsure which software is the right one for you or what market data you need? You can arrange a personal consultation session or simply call us at:
+49 231 9153-300. We would be happy to advise you!

Arrange a personal consultation session

Arrange consultation session

We are here for you


Sales

Mon-Thu: 8:30-17:00
Fri: 8:30-16:00
Phone: +49 231 9153-300
Fax: +49 231 9153-399
E-mail: sales@lp-software.com

Support

Mon+We: 08.30-17.00 Uhr
Tue+Thu: 08.30-14.00 Uhr
Fri: 08.30-16.00 Uhr
Phone: +49 231 9153-500
Fax: +49 231 9153-599
E-mail: support@lp-software.com

Lenz + Partner GmbH

Bronnerstr. 7
44141 Dortmund
Germany
Phone: +49 231 9153-300
E-mail: info@lp-software.com

By using the website, you consent to the use of cookies. Here you will find further information on Privacy Policy.